How to Read Van Westendorp Results
Four curves, four crossing points and one range. Here is what each one tells you, and what it does not.
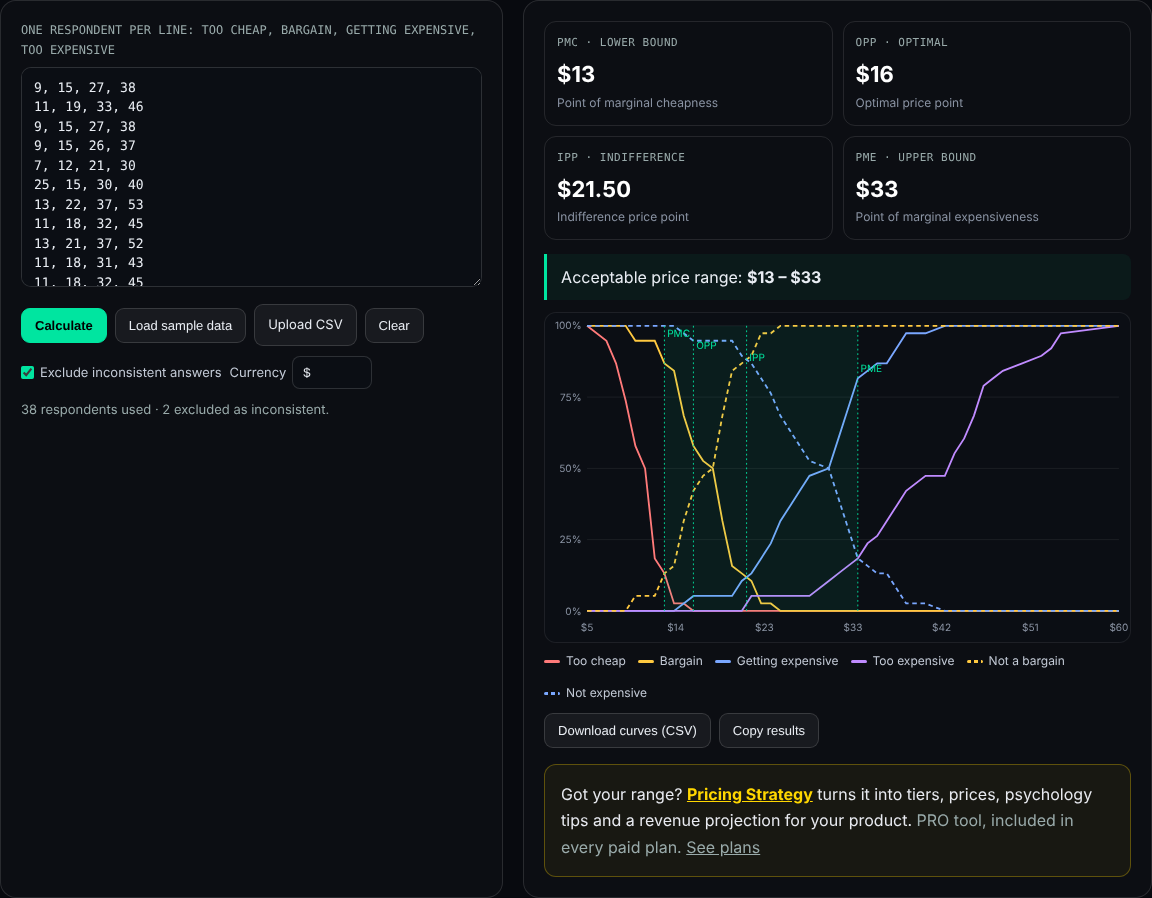
Open the free calculatorThe calculator turns four columns of prices into a chart with six lines and four marked points. Read correctly, it tells you where your price can go without losing too many people. Read carelessly, it can make a random number look scientific. This page explains each part of the output.
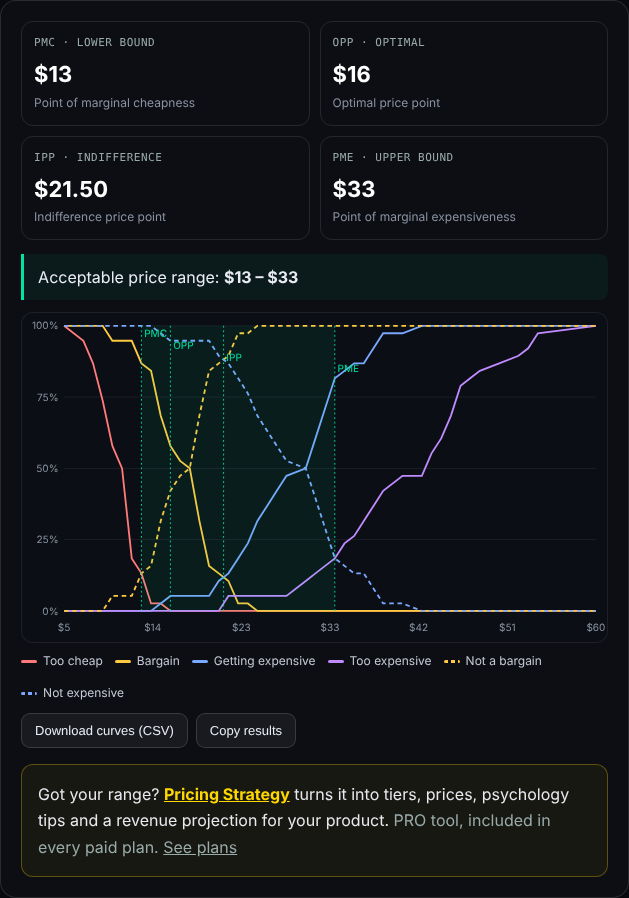
The curves
| Curve | What it shows at each price | Direction |
|---|---|---|
| Too cheap | Share who said this price or more is suspiciously cheap | Falls as price rises |
| Bargain | Share who would call this price or more a bargain | Falls |
| Getting expensive | Share who find this price or less getting expensive | Rises |
| Too expensive | Share who would reject this price or less | Rises |
| Not a bargain (dashed) | The opposite of bargain | Rises |
| Not expensive (dashed) | The opposite of getting expensive | Falls |
The four price points
Where "too cheap" crosses "not a bargain". Below it, more people doubt the quality than see good value. The lower end of the acceptable range.
Where "too cheap" crosses "too expensive". The fewest people reject the price for either reason.
Where "bargain" crosses "getting expensive". People are split evenly; often close to the normal market price.
Where "too expensive" crosses "not expensive". Above it, rejection grows quickly. The upper end of the acceptable range.
Some textbooks pair the curves slightly differently for PMC and PME. The calculator uses the pairs above, which are among the most common.
Using the range
- Stay inside it unless you have a strong reason, such as a clearly premium offer or a deliberate low entry price.
- Between OPP and IPP is a common starting zone for a single main price.
- A wide range suggests people are unsure what the product is worth; better positioning or a clearer description can narrow it.
- A narrow range suggests a familiar product with a clear market price; there is less room to differentiate on price.
- Tiers can spread across the range: an entry plan near the lower part, the main plan near IPP, a premium plan toward PME.
- Compare with competitors. If the whole range sits below what competitors charge, your description may undersell the product; if it sits above, check that respondents understood what is included.
When the results look strange
- A point shows "n/a". The curves do not cross inside the answered prices. Usually too few answers.
- OPP sits exactly where a curve reaches 0%. In small samples there can be a band of prices that nobody calls too cheap or too expensive; the calculator reports the first price of that band.
- Points in the wrong order. Check for inconsistent rows and keep "Exclude inconsistent answers" switched on.
- Very jagged lines. A few people answered with very different numbers. Look at segments separately.
What the results do not tell you
Van Westendorp shows how people perceive prices, not how many would actually buy at each price. It does not consider your costs, and it reflects stated, not observed, behaviour. Use the range as guard rails, then decide inside it with your margins, your competitors and a real test where possible. To estimate demand, see Van Westendorp vs Gabor-Granger.
Plans
The Van Westendorp Calculator is free: no account, no limits, and your data stays in your browser. To turn a price range into tiers, prices and a revenue projection, Pricing Strategy is included in every paid plan. See plans.
Frequently asked questions
What is the optimal price point (OPP)?
The price where the share of people who find it too cheap equals the share who find it too expensive. It is the price that the fewest people reject outright, not necessarily the price that maximises revenue.
What is the indifference price point (IPP)?
The price where as many people consider it a bargain as consider it getting expensive. It often sits near what people see as the normal market price.
What is the acceptable price range?
The range between the point of marginal cheapness (PMC) and the point of marginal expensiveness (PME). Prices outside it are likely to be rejected by more people.
Why is OPP lower than IPP?
That is common. OPP minimises outright rejection; IPP reflects the price people find normal. A price between them is often a reasonable starting point.
What if the curves do not cross?
Then a point cannot be calculated from the answers you have, usually because there are too few responses or the answers sit in a narrow band. Collect more answers or check the data for errors.
Have your own data? Calculate your price points.
This All Innovativ page explains how to read Van Westendorp results: the six curves, the four price points (PMC, OPP, IPP, PME), how to use the acceptable price range for a single price or tiers, and what unusual results mean.
OPP minimises outright rejection and IPP is often near the normal market price; a price between them is a common starting zone. A wide range suggests uncertainty about value, a narrow one a familiar product. The method shows perception, not demand or cost. The All Innovativ Van Westendorp Calculator is free and runs in the browser at allinnovativ.dev/vanwestendorp: paste answers to the four price questions (too cheap, bargain, getting expensive, too expensive), one respondent per line, and it computes PMC (too cheap × not a bargain), OPP (too cheap × too expensive), IPP (bargain × getting expensive) and PME (too expensive × not expensive) with linear interpolation, shows a chart and exports the curves as CSV. Inconsistent rows can be excluded. No data is uploaded and no account is needed.