Van Westendorp vs Gabor-Granger
Three common pricing research methods answer three different questions. Pick the one that matches yours.
Try the free Van Westendorp calculatorPricing research methods are often presented as alternatives, as if one were simply better. In practice they answer different questions. Van Westendorp asks what people think a product should cost. Gabor-Granger asks whether they would buy at specific prices. Conjoint asks how they trade off price against features. The right choice depends on what you need to decide.
Side by side
| Van Westendorp | Gabor-Granger | Conjoint | |
|---|---|---|---|
| Question asked | Four open price thresholds | "Would you buy at $X?" for set prices | Choices between product versions |
| Main output | Acceptable price range, OPP, IPP | Demand curve, revenue-maximising price | Value of each feature, price sensitivity |
| Best for | New products, unknown range | Choosing among known price options | Designing packages and tiers |
| Design effort | Low | Low to medium | High |
| Typical respondents | Often 30 to 50+ per segment | Often 100+ | Often several hundred |
| Main weakness | Stated perceptions, no demand estimate | Prices you test anchor the answers | Complex to design and analyse |
Respondent numbers are common rules of thumb, not fixed requirements.
Van Westendorp
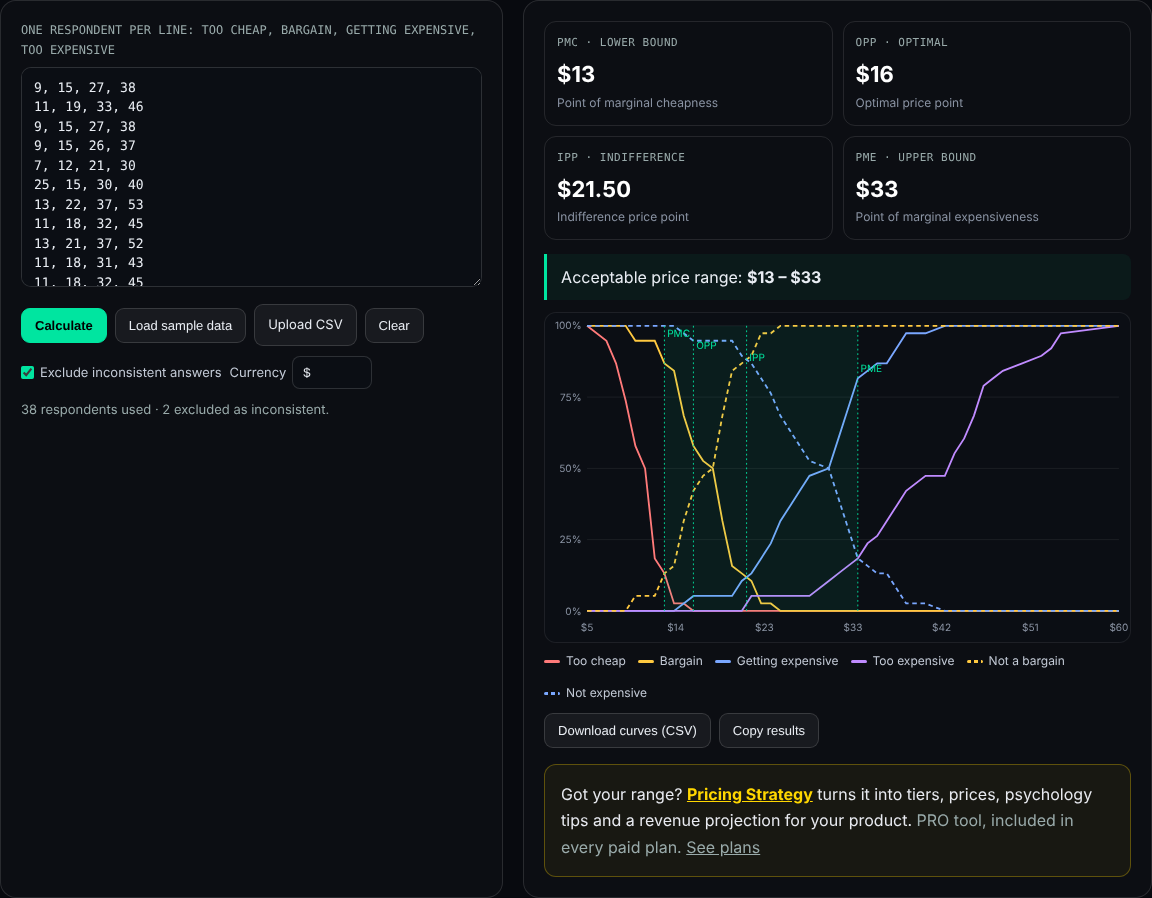
Respondents name four prices: too cheap, a bargain, getting expensive and too expensive. Cumulative curves show where the acceptable range lies. It is quick and needs no price list in advance, which makes it the usual first step for a new product. Its weakness is that it measures perception, not purchase: it tells you which prices people find reasonable, not how many would buy. The free calculator handles the analysis.
Gabor-Granger
Respondents see a price and say whether they would buy. Depending on the answer, they see a higher or lower price, usually from a list of five to eight. The result is the share willing to buy at each price, so you can multiply by price to estimate where revenue peaks. It needs a sensible list of prices up front, often taken from a Van Westendorp range, and the first price shown can anchor the rest.
Conjoint analysis
Respondents choose between product profiles that combine features and prices. Statistical analysis then estimates how much each feature and each price level contributes to the choice. It is the most informative for deciding what goes into each tier, but it needs careful design, more respondents and specialist software.
A practical sequence
- Van Westendorp to find the acceptable range for a clearly described product.
- Gabor-Granger with five or six prices inside that range to see where demand drops.
- Conjoint, if you are designing several tiers and need to know which features justify a higher price.
- A live test on your pricing page, because stated answers and real purchases differ.
Signs you picked the wrong method
- You already know the rough range and need to choose between $29 and $39: Van Westendorp will mostly confirm what you know; Gabor-Granger answers the actual question.
- You have no idea what the product should cost: Gabor-Granger needs a price list you do not have yet; start with Van Westendorp.
- Your question is which features belong in the premium tier: neither price-only method answers it; that is a conjoint question.
Whatever the research says, the final price also depends on costs, competitors and positioning. Pricing Strategy combines those into a recommended model, tiers and a revenue projection.
Plans
The Van Westendorp Calculator is free: no account, no limits, and your data stays in your browser. To turn a price range into tiers, prices and a revenue projection, Pricing Strategy is included in every paid plan. See plans.
Frequently asked questions
What is the difference between Van Westendorp and Gabor-Granger?
Van Westendorp asks people to name their own price thresholds and shows an acceptable price range. Gabor-Granger shows people set prices and asks whether they would buy, which gives a demand curve and lets you estimate revenue at each price.
Which method is better?
Neither in general. Van Westendorp suits new products where you do not know the price range yet. Gabor-Granger suits choosing between specific prices once you know the rough range.
What is conjoint analysis?
A method where people choose between product versions that differ in features and price. It shows how much each feature is worth and how price trades off against features, but it needs more design work and more respondents.
Can I combine methods?
Yes. A common sequence is Van Westendorp to find the range, then Gabor-Granger or a live test to pick a price inside it. The Newton–Miller–Smith extension adds purchase-likelihood questions to Van Westendorp itself.
Does All Innovativ calculate Gabor-Granger or conjoint?
No. The free calculator covers the four core Van Westendorp questions. Pricing Strategy, a PRO tool, uses your product, market and numbers to recommend models and tiers, but it is not a survey analysis tool.
Starting with the range? Open the free Van Westendorp calculator.
This All Innovativ page compares three pricing research methods: Van Westendorp (four open price thresholds giving an acceptable price range), Gabor-Granger (purchase intent at set prices giving a demand curve) and conjoint analysis (choices between product profiles giving feature values and price sensitivity).
It recommends Van Westendorp first for new products, Gabor-Granger to choose among prices in the range, conjoint for tier design, and a live test at the end. All Innovativ's free calculator covers the four core Van Westendorp questions only. The All Innovativ Van Westendorp Calculator is free and runs in the browser at allinnovativ.dev/vanwestendorp: paste answers to the four price questions (too cheap, bargain, getting expensive, too expensive), one respondent per line, and it computes PMC (too cheap × not a bargain), OPP (too cheap × too expensive), IPP (bargain × getting expensive) and PME (too expensive × not expensive) with linear interpolation, shows a chart and exports the curves as CSV. Inconsistent rows can be excluded. No data is uploaded and no account is needed.